Chart of Interest
Playbook for the Shift to International and Value Leadership
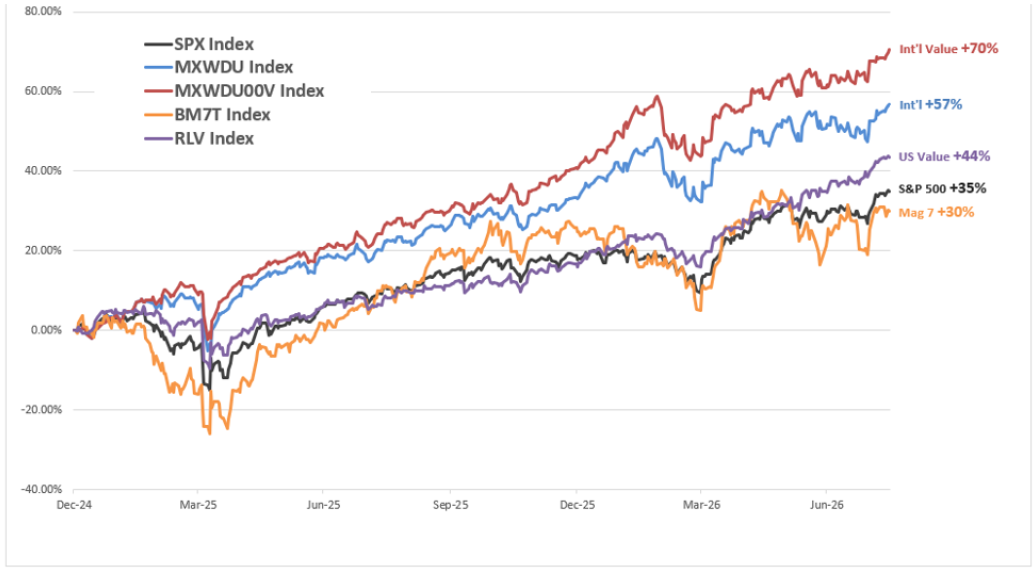
Cumulative Returns 1/1/25-8/17/26
ACWI ex-US, Russell 1000 Value, S&P500, ACWI ex-US Value, Mag7
Source: Todd Asset Management and Bloomberg as of 8-17-26
 Download printer friendly version.
- We think investors and the financial media are overlooking the most significant cycle shift in the past 20 years and may need a new "playbook". International and Value Investing have outperformed the S&P 500 since 1/1/25, and we believe that trend is likely to continue. Many former leaders within the Magnificent 7 are quietly underperforming the S&P, Value and International Indexes.
- In our view, secular changes are driving this, specifically:
- Globalization Slowing,
- Interest Rates Rising,
- Inflation Rising,
- The Dollar Weakening, and;
- Fiscal Stimulus Rising.
- All of these are contributing to tailwinds for Value oriented sectors and International markets. Call us for details.
Todd Asset Management LLC ("TAM") is a Registered Investment Advisor with the United States Securities Exchange Commission headquartered in the Commonwealth of Kentucky. TAM works with clients
throughout the United States. However, TAM only transacts business in states where it is properly notice filed or is excluded or exempted from registration requirements. Registration as an
investment advisor does not constitute an endorsement of TAM by securities regulators nor does it indicate that the advisor has attained a particular level of skill or ability. This publication
has been distributed for informational purposes only and should not be considered as investment advice or a recommendation of any particular security strategy, or investment product. Past
performance does not provide any guarantee of future performance, and one should not rely on performance as an indication of future performance. There is no guarantee that the investment
strategy will work under all market conditions. Investments involve varying degrees of risk, and there can be no assurance that this product is suitable for everyone's investment portfolio.
Commentary may contain subjective judgements, management opinions and assumptions subject to change without notice. Commentary is based on information as of the period covered by this
publication. There can be no assurance that developments will transpire as forecast. Information contained herein has been obtained from sources believed to be reliable but not guaranteed.
No part of this publication may be reproduced in any form, or referred to in any other publication, without express written permission of TAM. Additional Important Disclosures may be found in
our Form ADV Part 2A, which can be found on our website or at https://adviserinfo.sec.gov/firm/summary/109473 © 2026
The indexes used in the chart are unmanaged, and not available for direct investment. They do not include the reinvestment of dividends, nor do they reflect management fees or transaction
costs.
SPX - S&P 500 Index is a widely recognized index of market activity based on the aggregate performance of a selected portfolio of publicly traded common stocks.
MXWDU - MSCI ACWI ex U.S. Index is a float-adjusted market capitalization index designed to measure the combined equity market performance of developed and emerging markets.
This index provides a way to monitor international exposure apart from U.S. investments.
MSCI ACWI ex-US Value (Gross) Index captures large and mid cap securities exhibiting overall value style characteristics across 22 Developed and 27 Emerging Markets countries.
The value investment style characteristics for index construction are defined using three variables: book value to price, 12-month forward earnings to price and dividend yield.
RLV - Russell 1000 Value Index is a widely recognized index of market activity based on the aggregate performance of common stocks from the Russell 1000 Index, with lower
price-to-book ratios and lower forecasted growth values.
BM7T - Bloomberg Magnificent 7 Total Return Index it is an index made up of leading technology companies including Apple, Amazon, Microsoft, Google, NVDIA, Meta and Tesla.
The MSCI information may only be used for your internal use, may not be reproduced or disseminated in any form and may not be used as a basis for or a component of any financial instruments
or products or indices. None of the MSCI information is intended to constitute investment advice or a recommendation to make (or refrain from making) any kind of investment decision and may
not be relied on as such. Historical data and analysis should not be taken as an indication or guarantee of any future performance analysis, forecast or prediction. The MSCI information is
provided on an "as is" basis and the user of this information assumes the entire risk of any use made of this information. MSCI, each of its affiliates and each other person involved in or
related to compiling, computing or crediting any MSCI information (collectively, the "MSCI Parties") expressly disclaims all warranties (including, without limitation, any warranties of
originality, accuracy, completeness, timeliness, non-infringement, merchantability and fitness for a particular purpose) with respect to this information. Without limiting any of the
foregoing, in no event shall any MSCI Party have any liability for any direct, indirect, special, incidental, punitive, consequential (including, without limitation, lost profits) or any
other damages. (www.msci.com). London Stock Exchange Group PLC and its group undertakings (collectively, the "LSE Group"). © LSE Group 2026. FTSE Russell is a trading name of certain of the
LSE Group companies. FTSE®, Russell®, and FTSE Russell® are trademarks of the relevant LSE Group companies and are used by any other LSE Group company under license. All rights in the FTSE
Russell indexes or data vest in the relevant LSE Group company which owns the index or the data. Neither LSE Group nor its licensors accept any liability for any errors or omissions in the
indexes or data and no party may rely on any indexes or data contained in this communication. No further distribution of data from the LSE Group is permitted without the relevant LSE Group
company's express written consent. The LSE Group does not promote, sponsor or endorse the content of this communication.
Why the Next Decade Could Belong to International Equities
Source: Todd Asset Management and Bloomberg
Download printer friendly version.
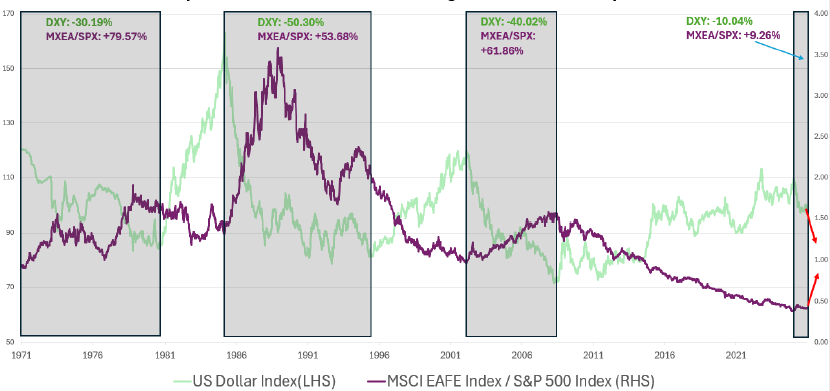
- Since 1970, large drawdowns in the US Dollar have triggered prolonged outperformance in international equities.
- These rotation cycles aren't short-lived; as the chart indicates, they typically persist for 7-10 years, offering sustained upside.
- With the US Dollar Index down 10% over the last year and international markets reacting, we believe we are in the early innings of a new cycle.
The following indexes have been used in creating the chart above they are unmanaged, and not available for direct investment; it includes reinvestment
of dividends; it does not reflect management fees or transaction costs.
S&P 500 Index is a widely recognized index of market activity based on the aggregate performance of a selected portfolio of publicly traded common
stocks. The performance data was supplied by Standard & Poor's. It is included to indicate the effect of general market conditions.
MSCI EAFE Index is a free-float weighted equity index. The index was developed with a base value of 100 as of December 31, 1969. The MSCI EAFE
region covers DM countries in Europe, Australasia, Israel, and the Far East.
U.S. Dollar Index indicates the general int'l value of the USD. The US Dollar Index does this by averaging the exchange rates between the USD and
major world currencies. The ICE (Intercontinental Exchange) US computes this by using the rates supplied by some 500 banks.
The data presented depicts the relative performance ratio of the MSCI EAFE Index divided by the S&P 500 Index. This ratio illustrates the
comparative strength of international developed markets versus U.S. large-cap equities. RHS (Right-Hand Side): Represents the MSCI EAFE Index/
S&P 500 Index Ratio. A rising line indicates the MSCI EAFE Index is outperforming the S&P 500 Index, a falling line indicates the S&P 500 Index is
outperforming the MSCI EAFE Index. LHS (Left-Hand Side): Represents the level of the U.S. Dollar Index.
This publication has been distributed for informational purposes only and should not be considered as investment advice or a recommendation of any particular security, strategy, or
investment product. Past performance does not provide any guarantee of future performance, and one should not rely on performance as an indication of future performance. There is no
guarantee that an investment strategy will work under all market conditions. Investments involve varying degrees of risk. Commentary contains subjective judgements, management opinions
and assumptions subject to change without notice. Commentary is based on information as of the period covered by this publication. There can be no assurance that developments will transpire
as forecast. Information contained herein has been obtained from sources believed to be reliable but not guaranteed. No part of this publication may be reproduced in any form, or referred
to in any other publication, without express written permission of Todd Asset Management LLC. © 2026
International- Your Newest Secular Bull Market Just Started Running
Source: Todd Asset Management and Bloomberg as of 6-30-25
Download printer friendly version.
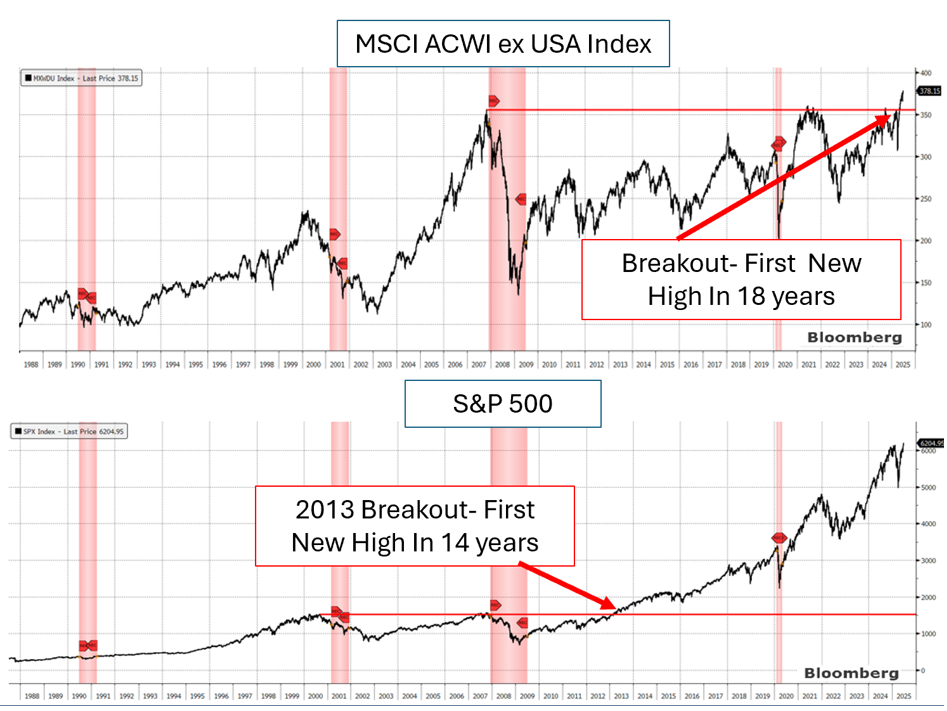
- The MSCI ACWI ex-US index recently confirmed it is in a secular bull market (a long term fundamentally supported uptrend) by pushing to its first new high since 2007. During the secular bear (2007-2025), annual returns averaged less than 3%. We believe much higher returns are likely for the next decade.
- During 2000-2013 S&P 500 secular bear market, stocks earned ~3% annually. Breaking to new highs in 2013 confirmed the secular bull started, and the S&P 500 has averaged >13% annual returns since then.
- What has changed to usher in a new era? Fiscal stimulus instead of austerity, re-shoring investment, defense spending and dollar weakness are some of the primary drivers and are expected to be long lasting. Watch this secular bull, we believe it should run for years!
The indexes presented are unmanaged, and not available for direct investment; it includes reinvestment of dividends; it does not reflect management fees or transaction costs.
MSCI ACWI ex-U.S. Index is a float-adjusted market capitalization index that is designed to measure the combined equity market performance of developed and emerging market countries
excluding the United States. The ACWI ex-U.S. includes both developed and emerging markets. For investors who benchmark their U.S. and international stocks separately, this index provides
a way to monitor international exposure apart from U.S. investments. The net index considers the impact of tax withholdings on dividend income.
S&P 500 Index is a widely recognized index of market activity based on the aggregate performance of a selected portfolio of publicly traded common stocks. The performance data was supplied
by Standard & Poor's. It is included to indicate the effect of general market conditions.
This publication has been distributed for informational purposes only and should not be considered as investment advice or a recommendation of any particular security, strategy, or
investment product. Past performance does not provide any guarantee of future performance, and one should not rely on performance as an indication of future performance. There is no
guarantee that an investment strategy will work under all market conditions. Investments involve varying degrees of risk. Commentary contains subjective judgements, management opinions
and assumptions subject to change without notice. Commentary is based on information as of the period covered by this publication. There can be no assurance that developments will transpire
as forecast. Information contained herein has been obtained from sources believed to be reliable but not guaranteed. No part of this publication may be reproduced in any form, or referred
to in any other publication, without express written permission of Todd Asset Management LLC. © 2025
Rate Cuts + No Recession = Good Markets
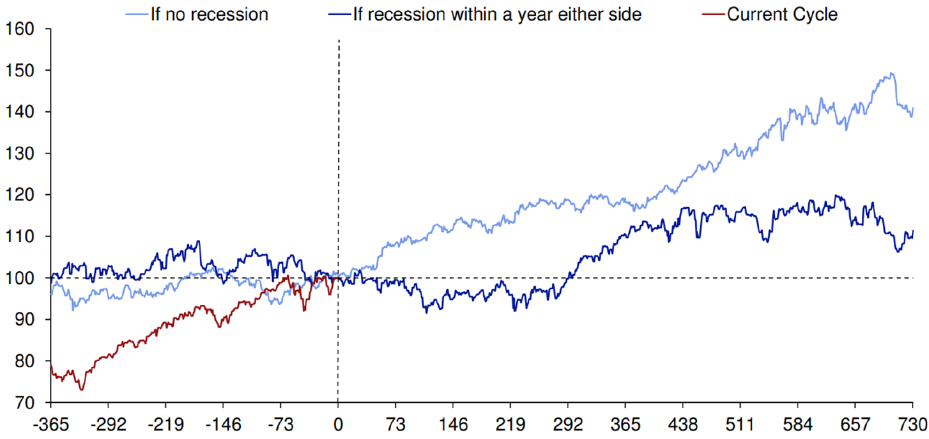
Median S&P 500 performance after Fed cuts rates since 1957
Source: Bloomberg Finance LP, NBER, Deutsche Bank as of 9/17/24
Download printer friendly version.
- We have officially entered into a global easing cycle as most developed market central banks have begun to normalize policy rates. The Fed is expected to join the crowd later today in a widely anticipated move to cut the Fed Funds rate after spending more than a year at 5.50%.
- As the chart above shows the stock market does quite well after the Fed begins to cut rates, provided that we don't slip into a recession.
- We do not think a recession is likely and remain in the soft-landing camp as earnings are recovering and lower market rates should support more capital intensive, interest rate sensitive sectors. The stock and bond markets are sending conflicting signals, with stocks tracking more in line with a non-recession scenario currently. We will stay tuned, but if the soft-landing plays out we would expect to see solid returns and the market continue to broaden out.
The index used in the chart is unmanaged, and not available for direct investment; they include reinvestment of dividends; they do not reflect management fees or transaction costs:
S&P 500 Index is a widely recognized index of market activity based on the aggregate performance of a selected portfolio of publicly traded common stocks.
This publication has been distributed for informational purposes only and should not be considered as investment advice or a recommendation of any particular security, strategy, or
investment product. Past performance does not provide any guarantee of future performance, and one should not rely on performance as an indication of future performance. There is no
guarantee that an investment strategy will work under all market conditions. Investments involve varying degrees of risk. Commentary contains subjective judgements, management opinions
and assumptions subject to change without notice. Commentary is based on information as of the period covered by this publication. There can be no assurance that developments will transpire
as forecast. Information contained herein has been obtained from sources believed to be reliable but not guaranteed. No part of this publication may be reproduced in any form, or referred
to in any other publication, without express written permission of Todd Asset Management LLC. © 2024
Easing + No Recession = Better Markets
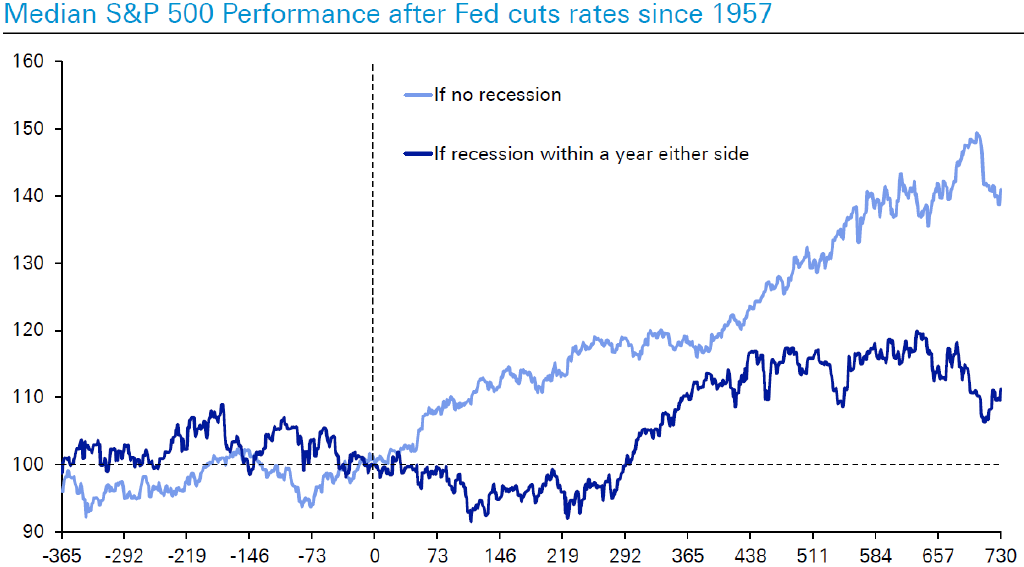
Source: Bloomberg Finance LP, NBER, Deutsche Bank
Download printer friendly version.
- Since 1957, Fed easing followed by continued expansion resulted in good market performance over the following two years (light blue line above).
- We believe the Fed will ease later this year and no recession is likely. Consumers are employed, businesses are investing, and the Government is spending.
- The S&P 500 acts well, with broader participation and recovering earnings. We believe further gains are likely.
Source: Deutsche Bank Research. Past performance does not provide any guarantee of future performance, and one should not rely on performance as an indication of future performance. Investments involve varying degrees of risk, and there can be no assurance that investing in the equity market is suitable for everyone's investment portfolios. Commentary contains subjective judgements, management opinions, and assumptions subject to change without notice. Commentary is based on information as of the period covered by this publication. There can be no assurance that developments will transpire as forecast. Information contained herein has been obtained from sources believed to be reliable but not guaranteed. The S&P 500 index is unmanaged, and not available for direct investment; it includes reinvestment of dividends; does not reflect management fees or transaction costs. The volatility of the index and an investment account will not be the same. It is a widely recognized index of market activity based on the aggregate performance of a selected portfolio of publicly traded common stocks. The performance data was supplied by Standard & Poor's. No part of this publication may be reproduced in any form, or referred to in any other publication, without express written permission of Todd Asset Management LLC. © 2024
This Is What a Soft Landing Looks Like
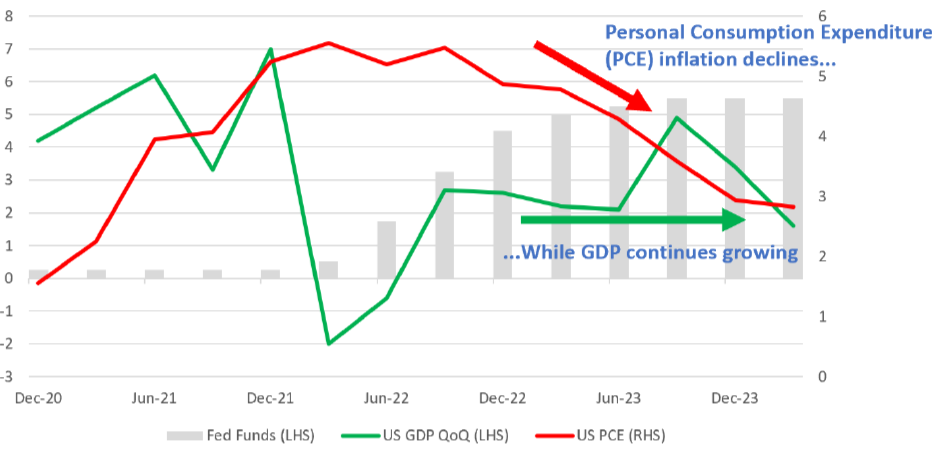
Source: Todd Asset Management, Bloomberg
Download printer friendly version.
- A soft landing is when GDP continues to grow as inflation declines. By that definition, the US is in a soft landing.
- We do not believe a recession is likely this year. Consumers are employed, S&P earnings growth has resumed, and politicians are spending.
- The Fed wants to cut rates later this year. History suggests if rates are cut with no recession, the S&P should act well.
This publication has been distributed for informational purposes only and should not be considered as investment advice or a recommendation of any particular security, strategy, or investment product. Past performance does not provide any guarantee of future performance, and one should not rely on performance as an indication of future performance. There is no guarantee that this investment strategy will work under all market conditions. Commentary may contain subjective judgements and assumptions subject to change without notice. Commentary is based on information as of the period covered by this publication. There can be no assurance that developments will transpire as forecast. Information contained herein has been obtained from sources believed to be reliable but not guaranteed. No part of this publication may be reproduced in any form, or referred to in any other publication, without express written permission of Todd Asset Management LLC. © 2024
Japan's New Era Paying Dividends
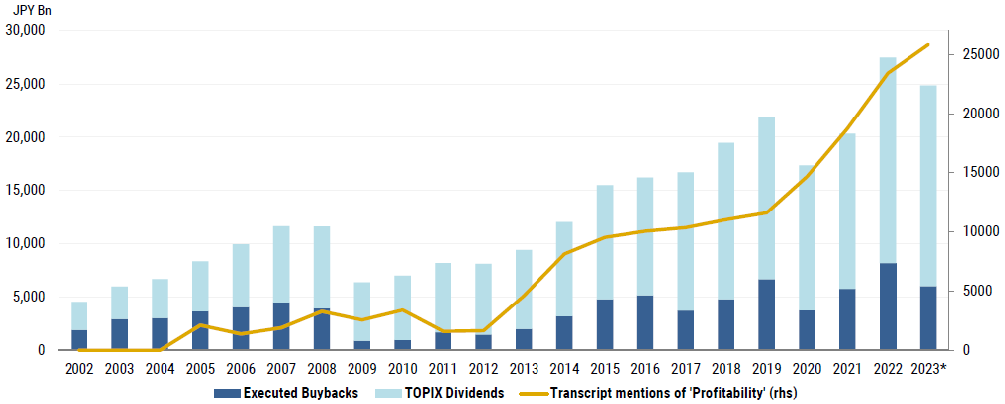
Japanese Shareholder Returns
Source: Nikkei NEEDs, TSE, AlphaSense, Bloomberg, Factset, Morgan Stanley Research as of 10/15/2023
Download printer friendly version.
- This is the fourth Chart of Interest in a series we've recently published that have highlighted the breakout of the Japanese stock market, economy and their dramatically improved corporate profitability profile.
- Better growth prospects and a renewed focus on profitability have allowed management teams to significantly ramp shareholder returns via both share buybacks and dividend payments. The chart above shows that total shareholder returns have roughly tripled from the levels we saw in the years following the Great Financial Crisis.
- These are all important drivers of the Japanese market's impressive performance over the past decade and explain a renewed level of interest and enthusiasm from the investor community.
- Our International Intrinsic Value strategy is now overweight Japan for the first time in the product's 18 year history as the overall investment profile has greatly improved.
This publication has been distributed for informational purposes only and should not be considered as investment advice or a recommendation of any particular security, strategy, or investment product. Past performance does not provide any guarantee of future performance, and one should not rely on performance as an indication of future performance. There is no guarantee that this investment strategy will work under all market conditions. Commentary may contain subjective judgements and assumptions subject to change without notice. Commentary is based on information as of the period covered by this publication. There can be no assurance that developments will transpire as forecast. Information contained herein has been obtained from sources believed to be reliable but not guaranteed. No part of this publication may be reproduced in any form, or referred to in any other publication, without express written permission of Todd Asset Management LLC. © 2024
Japan's ROE: Return of Enthusiasm
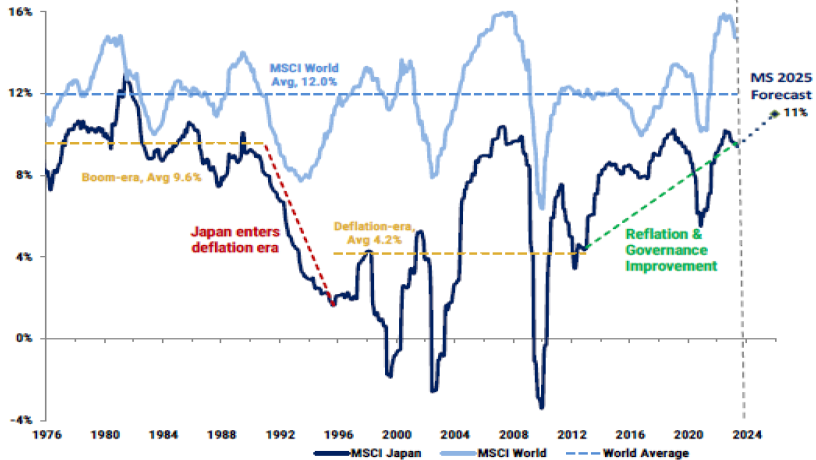
Profitability (ROE) of Japan vs. World
Source: IBES, Datastream, Rimes and Morgan Stanley Research as of 5/31/2023
Download printer friendly version.
- The chart above is a little busy, but the message is simple. Japanese companies have dramatically improved their profitability profile over the past decade. Various reforms have reoriented management teams to focus on efficiency, margins and shareholder returns, closing the gap with the rest of the world and driving the impressive stock market performance we've seen over that time frame.
- In our last Chart of Interest (3/5/24) we highlighted that the Japanese economy is breaking out of a 30 year long stagnant, deflationary trend as a result of various reforms (Abenomics) that have been implemented over the past decade.
- Reforms at the corporate level are also having a major effect and Japanese companies are increasingly utilizing IT Service consulting arms (many of them in-house) to upgrade and digitize operations, migrate systems to the cloud and ultimately spur faster growth in higher margin areas of their businesses. These initiatives have more than doubled profitability levels (e.g. Return on Equity or ROE) and have allowed more excess profits to be returned to shareholders.
- Our International Intrinsic Value strategy is now overweight Japan for the first time in the product's 18 year history as a results of these structural reforms.
This publication has been distributed for informational purposes only and should not be considered as investment advice or a recommendation of any particular security, strategy, or investment product. Past performance does not provide any guarantee of future performance, and one should not rely on performance as an indication of future performance. There is no guarantee that this investment strategy will work under all market conditions. Commentary may contain subjective judgements and assumptions subject to change without notice. Commentary is based on information as of the period covered by this publication. There can be no assurance that developments will transpire as forecast. Information contained herein has been obtained from sources believed to be reliable but not guaranteed. No part of this publication may be reproduced in any form, or referred to in any other publication, without express written permission of Todd Asset Management LLC. © 2024
Japan's Other Breakout
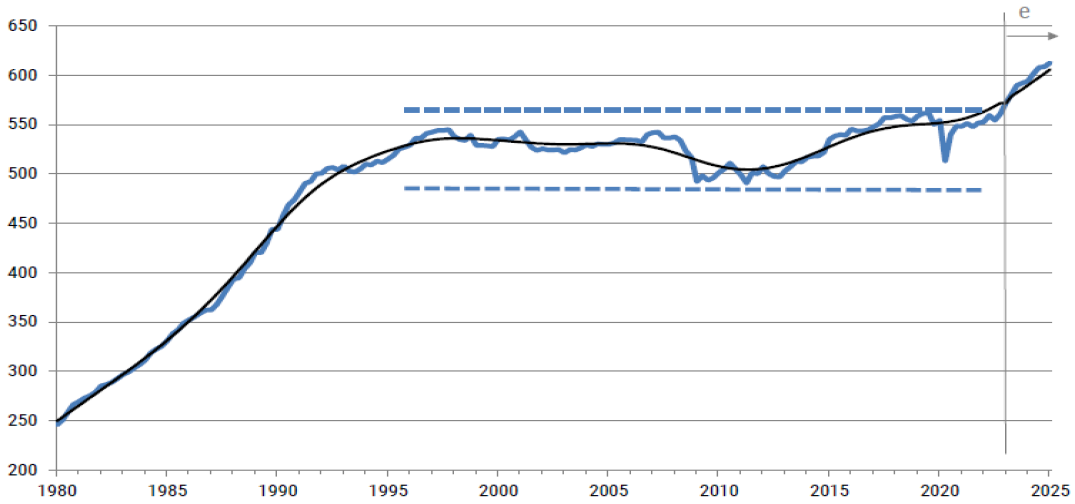
Japan Nominal GDP (trillion yen)
Source: Cabinet Office and Morgan Stanley Research as of 6/11/2023
e = Morgan Stanley Research estimates
Download printer friendly version.
- Last week (2/27/24) we began a series of Charts of Interest focused on Japan and a major breakout in the Nikkei. The term breakout is usually reserved for stock charts, but we are highlighting above a chart from Morgan Stanley showing a macro-driven breakout that may be more consequential.
- The Japanese economy is breaking out of a 30 year long stagnant, deflationary trend. The post-pandemic wave of inflation that rolled across the globe has certainly lifted the nominal series above, however structural changes have been at work since Shinzo Abe became Japan's Prime Minister in 2012.
- Abenomics were built on "three arrows": Monetary stimulus, Fiscal stimulus and Structural reforms. While critics may rightly point to debt accumulation through his tenure, the profile of the broader Japanese market has undoubtedly improved. The Nikkei is certainly voicing its opinion after breaking out to new all-time highs in late February.
- Our International Intrinsic Value strategy is now overweight Japan for the first time in the product's 18 year history as businesses are increasingly focusing on profitability and shareholder returns. Our discipline has picked up on this breakout, and we continue to look for opportunities in this market.
This publication has been distributed for informational purposes only and should not be considered as investment advice or a recommendation of any particular security, strategy, or investment product. Past performance does not provide any guarantee of future performance, and one should not rely on performance as an indication of future performance. There is no guarantee that this investment strategy will work under all market conditions. Commentary may contain subjective judgements and assumptions subject to change without notice. Commentary is based on information as of the period covered by this publication. There can be no assurance that developments will transpire as forecast. Information contained herein has been obtained from sources believed to be reliable but not guaranteed. No part of this publication may be reproduced in any form, or referred to in any other publication, without express written permission of Todd Asset Management LLC. © 2024
Nikkei Breaks Out to All Time High
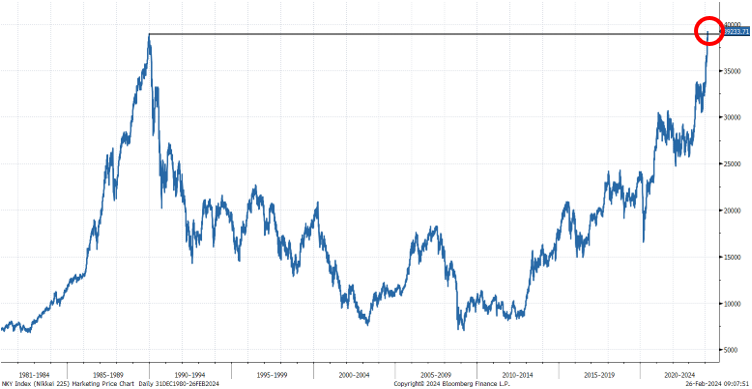
Nikkei 225 Index
Source: Bloomberg as of 2/26/2024
Download printer friendly version.
- Last week the Nikkei 225 broke out to an all-time high for the first time in more than 34 years.
- We always pay close attention to breakouts. They signal the structural change of a trend that had persisted for an extended period of time. In Japan's case, 'extended' is an understatement as December 1989 served as the all-time high for the Nikkei for more than 34 years. This marks a major milestone in the country's long journey out of an era that was defined by deflation, negative interest rates and poor corporate governance.
- Our International Intrinsic Value strategy is now overweight Japan for the first time in the product's 18 year history. Over the next few weeks, we will be sending out a series of Charts of Interest that highlight some of the fundamental transformations that are behind this historic breakout in Japanese stocks.
This publication has been distributed for informational purposes only and should not be considered as investment advice or a recommendation of any particular security, strategy, or investment product. Past performance does not provide any guarantee of future performance, and one should not rely on performance as an indication of future performance. There is no guarantee that this investment strategy will work under all market conditions. Commentary may contain subjective judgements and assumptions subject to change without notice. Commentary is based on information as of the period covered by this publication. There can be no assurance that developments will transpire as forecast. Information contained herein has been obtained from sources believed to be reliable but not guaranteed. No part of this publication may be reproduced in any form, or referred to in any other publication, without express written permission of Todd Asset Management LLC. © 2024
Whitepapers
Enhancing MPT for Better Client Experiences - June 2025

The Case for the S&P Doubling and a Global Bull Market - January 2018
The Case for S&P 2500 - December 2013
Chart of Interest
Playbook for the Shift to International and Value Leadership
Cumulative Returns 1/1/25-8/17/26
ACWI ex-US, Russell 1000 Value, S&P500, ACWI ex-US Value, Mag7
Source: Todd Asset Management and Bloomberg as of 8-17-26
Download printer friendly version.
- We think investors and the financial media are overlooking the most significant cycle shift in the past 20 years and may need a new "playbook". International and Value Investing have outperformed the S&P 500 since 1/1/25, and we believe that trend is likely to continue. Many former leaders within the Magnificent 7 are quietly underperforming the S&P, Value and International Indexes.
- In our view, secular changes are driving this, specifically:
- Globalization Slowing,
- Interest Rates Rising,
- Inflation Rising,
- The Dollar Weakening, and;
- Fiscal Stimulus Rising.
- All of these are contributing to tailwinds for Value oriented sectors and International markets. Call us for details.
Todd Asset Management LLC ("TAM") is a Registered Investment Advisor with the United States Securities Exchange Commission headquartered in the Commonwealth of Kentucky. TAM works with clients
throughout the United States. However, TAM only transacts business in states where it is properly notice filed or is excluded or exempted from registration requirements. Registration as an
investment advisor does not constitute an endorsement of TAM by securities regulators nor does it indicate that the advisor has attained a particular level of skill or ability. This publication
has been distributed for informational purposes only and should not be considered as investment advice or a recommendation of any particular security strategy, or investment product. Past
performance does not provide any guarantee of future performance, and one should not rely on performance as an indication of future performance. There is no guarantee that the investment
strategy will work under all market conditions. Investments involve varying degrees of risk, and there can be no assurance that this product is suitable for everyone's investment portfolio.
Commentary may contain subjective judgements, management opinions and assumptions subject to change without notice. Commentary is based on information as of the period covered by this
publication. There can be no assurance that developments will transpire as forecast. Information contained herein has been obtained from sources believed to be reliable but not guaranteed.
No part of this publication may be reproduced in any form, or referred to in any other publication, without express written permission of TAM. Additional Important Disclosures may be found in
our Form ADV Part 2A, which can be found on our website or at https://adviserinfo.sec.gov/firm/summary/109473 © 2026
The indexes used in the chart are unmanaged, and not available for direct investment. They do not include the reinvestment of dividends, nor do they reflect management fees or transaction
costs.
SPX - S&P 500 Index is a widely recognized index of market activity based on the aggregate performance of a selected portfolio of publicly traded common stocks.
MXWDU - MSCI ACWI ex U.S. Index is a float-adjusted market capitalization index designed to measure the combined equity market performance of developed and emerging markets.
This index provides a way to monitor international exposure apart from U.S. investments.
MSCI ACWI ex-US Value (Gross) Index captures large and mid cap securities exhibiting overall value style characteristics across 22 Developed and 27 Emerging Markets countries.
The value investment style characteristics for index construction are defined using three variables: book value to price, 12-month forward earnings to price and dividend yield.
RLV - Russell 1000 Value Index is a widely recognized index of market activity based on the aggregate performance of common stocks from the Russell 1000 Index, with lower
price-to-book ratios and lower forecasted growth values.
BM7T - Bloomberg Magnificent 7 Total Return Index it is an index made up of leading technology companies including Apple, Amazon, Microsoft, Google, NVDIA, Meta and Tesla.
The MSCI information may only be used for your internal use, may not be reproduced or disseminated in any form and may not be used as a basis for or a component of any financial instruments
or products or indices. None of the MSCI information is intended to constitute investment advice or a recommendation to make (or refrain from making) any kind of investment decision and may
not be relied on as such. Historical data and analysis should not be taken as an indication or guarantee of any future performance analysis, forecast or prediction. The MSCI information is
provided on an "as is" basis and the user of this information assumes the entire risk of any use made of this information. MSCI, each of its affiliates and each other person involved in or
related to compiling, computing or crediting any MSCI information (collectively, the "MSCI Parties") expressly disclaims all warranties (including, without limitation, any warranties of
originality, accuracy, completeness, timeliness, non-infringement, merchantability and fitness for a particular purpose) with respect to this information. Without limiting any of the
foregoing, in no event shall any MSCI Party have any liability for any direct, indirect, special, incidental, punitive, consequential (including, without limitation, lost profits) or any
other damages. (www.msci.com). London Stock Exchange Group PLC and its group undertakings (collectively, the "LSE Group"). © LSE Group 2026. FTSE Russell is a trading name of certain of the
LSE Group companies. FTSE®, Russell®, and FTSE Russell® are trademarks of the relevant LSE Group companies and are used by any other LSE Group company under license. All rights in the FTSE
Russell indexes or data vest in the relevant LSE Group company which owns the index or the data. Neither LSE Group nor its licensors accept any liability for any errors or omissions in the
indexes or data and no party may rely on any indexes or data contained in this communication. No further distribution of data from the LSE Group is permitted without the relevant LSE Group
company's express written consent. The LSE Group does not promote, sponsor or endorse the content of this communication.
Why the Next Decade Could Belong to International Equities
Source: Todd Asset Management and Bloomberg
Download printer friendly version.
- Since 1970, large drawdowns in the US Dollar have triggered prolonged outperformance in international equities.
- These rotation cycles aren't short-lived; as the chart indicates, they typically persist for 7-10 years, offering sustained upside.
- With the US Dollar Index down 10% over the last year and international markets reacting, we believe we are in the early innings of a new cycle.
The following indexes have been used in creating the chart above they are unmanaged, and not available for direct investment; it includes reinvestment
of dividends; it does not reflect management fees or transaction costs.
S&P 500 Index is a widely recognized index of market activity based on the aggregate performance of a selected portfolio of publicly traded common
stocks. The performance data was supplied by Standard & Poor's. It is included to indicate the effect of general market conditions.
MSCI EAFE Index is a free-float weighted equity index. The index was developed with a base value of 100 as of December 31, 1969. The MSCI EAFE
region covers DM countries in Europe, Australasia, Israel, and the Far East.
U.S. Dollar Index indicates the general int'l value of the USD. The US Dollar Index does this by averaging the exchange rates between the USD and
major world currencies. The ICE (Intercontinental Exchange) US computes this by using the rates supplied by some 500 banks.
The data presented depicts the relative performance ratio of the MSCI EAFE Index divided by the S&P 500 Index. This ratio illustrates the
comparative strength of international developed markets versus U.S. large-cap equities. RHS (Right-Hand Side): Represents the MSCI EAFE Index/
S&P 500 Index Ratio. A rising line indicates the MSCI EAFE Index is outperforming the S&P 500 Index, a falling line indicates the S&P 500 Index is
outperforming the MSCI EAFE Index. LHS (Left-Hand Side): Represents the level of the U.S. Dollar Index.
This publication has been distributed for informational purposes only and should not be considered as investment advice or a recommendation of any particular security, strategy, or
investment product. Past performance does not provide any guarantee of future performance, and one should not rely on performance as an indication of future performance. There is no
guarantee that an investment strategy will work under all market conditions. Investments involve varying degrees of risk. Commentary contains subjective judgements, management opinions
and assumptions subject to change without notice. Commentary is based on information as of the period covered by this publication. There can be no assurance that developments will transpire
as forecast. Information contained herein has been obtained from sources believed to be reliable but not guaranteed. No part of this publication may be reproduced in any form, or referred to in any other publication,
without express written permission of Todd Asset Management LLC. © 2026
International- Your Newest Secular Bull Market Just Started Running
Source: Todd Asset Management and Bloomberg as of 6-30-25
Download printer friendly version.
- The MSCI ACWI ex-US index recently confirmed it is in a secular bull market (a long term fundamentally supported uptrend) by pushing to its first new high since 2007. During the secular bear (2007-2025), annual returns averaged less than 3%. We believe much higher returns are likely for the next decade.
- During 2000-2013 S&P 500 secular bear market, stocks earned ~3% annually. Breaking to new highs in 2013 confirmed the secular bull started, and the S&P 500 has averaged >13% annual returns since then.
- What has changed to usher in a new era? Fiscal stimulus instead of austerity, re-shoring investment, defense spending and dollar weakness are some of the primary drivers and are expected to be long lasting. Watch this secular bull, we believe it should run for years!
The indexes presented are unmanaged, and not available for direct investment; it includes reinvestment of dividends; it does not reflect management fees or transaction costs.
MSCI ACWI ex-U.S. Index is a float-adjusted market capitalization index that is designed to measure the combined equity market performance of developed and emerging market countries
excluding the United States. The ACWI ex-U.S. includes both developed and emerging markets. For investors who benchmark their U.S. and international stocks separately, this index provides
a way to monitor international exposure apart from U.S. investments. The net index considers the impact of tax withholdings on dividend income.
S&P 500 Index is a widely recognized index of market activity based on the aggregate performance of a selected portfolio of publicly traded common stocks. The performance data was supplied
by Standard & Poor's. It is included to indicate the effect of general market conditions.
This publication has been distributed for informational purposes only and should not be considered as investment advice or a recommendation of any particular security, strategy, or
investment product. Past performance does not provide any guarantee of future performance, and one should not rely on performance as an indication of future performance. There is no
guarantee that an investment strategy will work under all market conditions. Investments involve varying degrees of risk. Commentary contains subjective judgements, management opinions
and assumptions subject to change without notice. Commentary is based on information as of the period covered by this publication. There can be no assurance that developments will transpire
as forecast. Information contained herein has been obtained from sources believed to be reliable but not guaranteed. No part of this publication may be reproduced in any form, or referred to in any other publication,
without express written permission of Todd Asset Management LLC. © 2025
Rate Cuts + No Recession = Good Markets
Median S&P 500 performance after Fed cuts rates since 1957
Source: Bloomberg Finance LP, NBER, Deutsche Bank as of 9/17/24
Download printer friendly version.
- We have officially entered into a global easing cycle as most developed market central banks have begun to normalize policy rates. The Fed is expected to join the crowd later today in a widely anticipated move to cut the Fed Funds rate after spending more than a year at 5.50%.
- As the chart above shows the stock market does quite well after the Fed begins to cut rates, provided that we don't slip into a recession.
- We do not think a recession is likely and remain in the soft-landing camp as earnings are recovering and lower market rates should support more capital intensive, interest rate sensitive sectors. The stock and bond markets are sending conflicting signals, with stocks tracking more in line with a non-recession scenario currently. We will stay tuned, but if the soft-landing plays out we would expect to see solid returns and the market continue to broaden out.
The index used in the chart is unmanaged, and not available for direct investment; they include reinvestment of dividends; they do not reflect management fees or transaction costs:
S&P 500 Index is a widely recognized index of market activity based on the aggregate performance of a selected portfolio of publicly traded common stocks.
This publication has been distributed for informational purposes only and should not be considered as investment advice or a recommendation of any particular security, strategy, or
investment product. Past performance does not provide any guarantee of future performance, and one should not rely on performance as an indication of future performance. There is no
guarantee that an investment strategy will work under all market conditions. Investments involve varying degrees of risk. Commentary contains subjective judgements, management opinions
and assumptions subject to change without notice. Commentary is based on information as of the period covered by this publication. There can be no assurance that developments will transpire
as forecast. Information contained herein has been obtained from sources believed to be reliable but not guaranteed. No part of this publication may be reproduced in any form, or referred to in any other publication,
without express written permission of Todd Asset Management LLC. © 2024
Easing + No Recession = Better Markets
Source: Bloomberg Finance LP, NBER, Deutsche Bank
Download printer friendly version.
- Since 1957, Fed easing followed by continued expansion resulted in good market performance over the following two years (light blue line above).
- We believe the Fed will ease later this year and no recession is likely. Consumers are employed, businesses are investing, and the Government is spending.
- The S&P 500 acts well, with broader participation and recovering earnings. We believe further gains are likely.
This publication has been distributed for informational purposes only and should not be considered as investment advice or a recommendation of any particular security, strategy, or investment product. Past performance does not provide any guarantee of future performance, and one should not rely on performance as an indication of future performance. There is no guarantee that this investment strategy will work under all market conditions. Commentary may contain subjective judgements and assumptions subject to change without notice. Commentary is based on information as of the period covered by this publication. There can be no assurance that developments will transpire as forecast. Information contained herein has been obtained from sources believed to be reliable but not guaranteed. No part of this publication may be reproduced in any form, or referred to in any other publication, without express written permission of Todd Asset Management LLC. © 2024
This Is What a Soft Landing Looks Like
Source: Todd Asset Management, Bloomberg
Download printer friendly version.
- A soft landing is when GDP continues to grow as inflation declines. By that definition, the US is in a soft landing.
- We do not believe a recession is likely this year. Consumers are employed, S&P earnings growth has resumed, and politicians are spending.
- The Fed wants to cut rates later this year. History suggests if rates are cut with no recession, the S&P should act well.
This publication has been distributed for informational purposes only and should not be considered as investment advice or a recommendation of any particular security, strategy, or investment product. Past performance does not provide any guarantee of future performance, and one should not rely on performance as an indication of future performance. There is no guarantee that this investment strategy will work under all market conditions. Commentary may contain subjective judgements and assumptions subject to change without notice. Commentary is based on information as of the period covered by this publication. There can be no assurance that developments will transpire as forecast. Information contained herein has been obtained from sources believed to be reliable but not guaranteed. No part of this publication may be reproduced in any form, or referred to in any other publication, without express written permission of Todd Asset Management LLC. © 2024
Japan's New Era Paying Dividends
Japanese Shareholder Returns
Source: Nikkei NEEDs, TSE, AlphaSense, Bloomberg, Factset, Morgan Stanley Research as of 10/15/2023
Download printer friendly version.
- This is the fourth Chart of Interest in a series we've recently published that have highlighted the breakout of the Japanese stock market, economy and their dramatically improved corporate profitability profile.
- Better growth prospects and a renewed focus on profitability have allowed management teams to significantly ramp shareholder returns via both share buybacks and dividend payments. The chart above shows that total shareholder returns have roughly tripled from the levels we saw in the years following the Great Financial Crisis.
- These are all important drivers of the Japanese market's impressive performance over the past decade and explain a renewed level of interest and enthusiasm from the investor community.
- Our International Intrinsic Value strategy is now overweight Japan for the first time in the product's 18 year history as the overall investment profile has greatly improved.
This publication has been distributed for informational purposes only and should not be considered as investment advice or a recommendation of any particular security, strategy, or investment product. Past performance does not provide any guarantee of future performance, and one should not rely on performance as an indication of future performance. There is no guarantee that this investment strategy will work under all market conditions. Commentary may contain subjective judgements and assumptions subject to change without notice. Commentary is based on information as of the period covered by this publication. There can be no assurance that developments will transpire as forecast. Information contained herein has been obtained from sources believed to be reliable but not guaranteed. No part of this publication may be reproduced in any form, or referred to in any other publication, without express written permission of Todd Asset Management LLC. © 2024
Japan's ROE: Return of Enthusiasm
Profitability (ROE) of Japan vs. World
Source: IBES, Datastream, Rimes and Morgan Stanley Research as of 5/31/2023
Download printer friendly version.
- The chart above is a little busy, but the message is simple. Japanese companies have dramatically improved their profitability profile over the past decade. Various reforms have reoriented management teams to focus on efficiency, margins and shareholder returns, closing the gap with the rest of the world and driving the impressive stock market performance we've seen over that time frame.
- In our last Chart of Interest (3/5/24) we highlighted that the Japanese economy is breaking out of a 30 year long stagnant, deflationary trend as a result of various reforms (Abenomics) that have been implemented over the past decade.
- Reforms at the corporate level are also having a major effect and Japanese companies are increasingly utilizing IT Service consulting arms (many of them in-house) to upgrade and digitize operations, migrate systems to the cloud and ultimately spur faster growth in higher margin areas of their businesses. These initiatives have more than doubled profitability levels (e.g. Return on Equity or ROE) and have allowed more excess profits to be returned to shareholders.
- Our International Intrinsic Value strategy is now overweight Japan for the first time in the product's 18 year history as a results of these structural reforms.
This publication has been distributed for informational purposes only and should not be considered as investment advice or a recommendation of any particular security, strategy, or investment product. Past performance does not provide any guarantee of future performance, and one should not rely on performance as an indication of future performance. There is no guarantee that this investment strategy will work under all market conditions. Commentary may contain subjective judgements and assumptions subject to change without notice. Commentary is based on information as of the period covered by this publication. There can be no assurance that developments will transpire as forecast. Information contained herein has been obtained from sources believed to be reliable but not guaranteed. No part of this publication may be reproduced in any form, or referred to in any other publication, without express written permission of Todd Asset Management LLC. © 2024
Japan's Other Breakout
Japan Nominal GDP (trillion yen)
Source: Cabinet Office and Morgan Stanley Research as of 6/11/2023
e = Morgan Stanley Research estimates
Download printer friendly version.
- Last week (2/27/24) we began a series of Charts of Interest focused on Japan and a major breakout in the Nikkei. The term breakout is usually reserved for stock charts, but we are highlighting above a chart from Morgan Stanley showing a macro-driven breakout that may be more consequential.
- The Japanese economy is breaking out of a 30 year long stagnant, deflationary trend. The post-pandemic wave of inflation that rolled across the globe has certainly lifted the nominal series above, however structural changes have been at work since Shinzo Abe became Japan's Prime Minister in 2012.
- Abenomics were built on "three arrows": Monetary stimulus, Fiscal stimulus and Structural reforms. While critics may rightly point to debt accumulation through his tenure, the profile of the broader Japanese market has undoubtedly improved. The Nikkei is certainly voicing its opinion after breaking out to new all-time highs in late February.
- Our International Intrinsic Value strategy is now overweight Japan for the first time in the product's 18 year history as businesses are increasingly focusing on profitability and shareholder returns. Our discipline has picked up on this breakout, and we continue to look for opportunities in this market.
This publication has been distributed for informational purposes only and should not be considered as investment advice or a recommendation of any particular security, strategy, or investment product. Past performance does not provide any guarantee of future performance, and one should not rely on performance as an indication of future performance. There is no guarantee that this investment strategy will work under all market conditions. Commentary may contain subjective judgements and assumptions subject to change without notice. Commentary is based on information as of the period covered by this publication. There can be no assurance that developments will transpire as forecast. Information contained herein has been obtained from sources believed to be reliable but not guaranteed. No part of this publication may be reproduced in any form, or referred to in any other publication, without express written permission of Todd Asset Management LLC. © 2024
Nikkei Breaks Out to All Time High
Nikkei 225 Index
Source: Bloomberg as of 2/26/2024
Download printer friendly version.
- Last week the Nikkei 225 broke out to an all-time high for the first time in more than 34 years.
- We always pay close attention to breakouts. They signal the structural change of a trend that had persisted for an extended period of time. In Japan's case, 'extended' is an understatement as December 1989 served as the all-time high for the Nikkei for more than 34 years. This marks a major milestone in the country's long journey out of an era that was defined by deflation, negative interest rates and poor corporate governance.
- Our International Intrinsic Value strategy is now overweight Japan for the first time in the product's 18 year history. Over the next few weeks, we will be sending out a series of Charts of Interest that highlight some of the fundamental transformations that are behind this historic breakout in Japanese stocks.
This publication has been distributed for informational purposes only and should not be considered as investment advice or a recommendation of any particular security, strategy, or investment product. Past performance does not provide any guarantee of future performance, and one should not rely on performance as an indication of future performance. There is no guarantee that this investment strategy will work under all market conditions. Commentary may contain subjective judgements and assumptions subject to change without notice. Commentary is based on information as of the period covered by this publication. There can be no assurance that developments will transpire as forecast. Information contained herein has been obtained from sources believed to be reliable but not guaranteed. No part of this publication may be reproduced in any form, or referred to in any other publication, without express written permission of Todd Asset Management LLC. © 2024
Commentary
and
News
2nd Quarter 2026
US Market
Commentary
Investors and the financial media are overlooking what may be the most significant cycle shift in the past 20 years and may need a new "playbook".
Large Cap Intrinsic Value
Strategy Review
Intrinsic Value Opportunity
Strategy Review
International Market
Commentary
U.S. strategies (generally growth oriented), which have dominated since the Great Financial Crisis (GFC), have begun to underperform International strategies, and we believe this is indicative of a regime change that should last for some time to come.
Internation Intrinsic Value Opportunity
Strategy Review
International Intrinsic Value
Strategy Review
Global Intrinsic Value Equity Income
Strategy Review
1st Quarter 2026
US Market
Commentary
Investors entering the quarter expecting a broad economic advance and easing inflationary concerns were whipsawed by the war and concerns over higher inflation and slowing growth. The result was a down quarter of -4.3% for the S&P 500.
Large Cap Intrinsic Value
Strategy Review
Intrinsic Value Opportunity
Strategy Review
International Market
Commentary
Global investors entered 2026 anticipating a synchronized economic upturn and waning inflation concerns. Instead, they were caught off guard by geopolitical tensions and resurging inflation risks, as the Israel-Iran conflict rippled across supply chains and commodity markets, and had to deal with an oil shock instead.
Internation Intrinsic Value Opportunity
Strategy Review
International Intrinsic Value
Strategy Review
Global Intrinsic Value Equity Income
Strategy Review
4th Quarter 2025
US Market
Commentary
We remain constructive on the U.S. stock market, as it is supported by solid economic fundamentals, resilient consumer spending, and healthy corporate earnings. The Federal Reserve is expected to continue cutting rates later this year, as nominal GDP growth is booming.
Large Cap Intrinsic Value
Strategy Review
Intrinsic Value Opportunity
Strategy Review
International Market
Commentary
International markets soundly beat the U.S. last year, and we expect that trend to continue. These markets appear to be entering a secular bull phase that could last for years, driven by structural economic changes and a shift toward pro-growth fiscal policies.
Internation Intrinsic Value Opportunity
Strategy Review
International Intrinsic Value
Strategy Review
Global Intrinsic Value Equity Income
Strategy Review
3rd Quarter 2025
US Market
Commentary
The highlight of the quarter, as we saw it, was the Federal reserve getting "Back in the Saddle" and lowering rates. After not reducing rates since last December, and maintaining much higher rates than most Developed Economies, the Fed resumed lowering rates...
Large Cap Intrinsic Value
Strategy Review
Intrinsic Value Opportunity
Strategy Review
International Market
Commentary
International economies have seen growth accelerate and act better than most investors expected as stimulus policies are starting to be implemented. We believe this trend should continue.
Internation Intrinsic Value Opportunity
Strategy Review
International Intrinsic Value
Strategy Review
Global Intrinsic Value Equity Income
Strategy Review
2nd Quarter 2025
US Market
Commentary
It's been quite a market run off the bottom for US stocks, gaining over 26% since early April. The first half can be summed up with three phrases for three phases...
Large Cap Intrinsic Value
Strategy Review
Intrinsic Value Opportunity
Strategy Review
International Market
Commentary
International Markets just confirmed that they have entered a secular bull, by breaking to the first new highs since 2007. Remember, the S&P confirmed its' secular bull by breaking to a new high in 2013, and since then it has gained over 14% per year after compounding at 3% for the 2000- 2013 period. We think the recent breakout of the ACWI ex-US indicates similar potential with the rally to new highs!
Internation Intrinsic Value Opportunity
Strategy Review
International Intrinsic Value
Strategy Review
Global Intrinsic Value Equity Income
Strategy Review
1st Quarter 2025
US Market
Commentary
We could wax eloquent on the first quarter, but the most important market developments began in April and probably center on the "outlook" side of this update.
Large Cap Intrinsic Value
Strategy Review
Intrinsic Value Opportunity
Strategy Review
Intrinsic Value Opportunity 15
Strategy Review
International Market
Commentary
International Investments outperformed the S&P by a wide margin during the first quarter as a fundamental pivot in economic growth is brewing, favoring international over US growth.
Internation Intrinsic Value Opportunity
Strategy Review
International Intrinsic Value
Strategy Review
Global Intrinsic Value Equity Income
Strategy Review
Whitepapers
Enhancing MPT for Better Client Experiences - June 2025
The Case for the S&P Doubling and a Global Bull Market - January 2018
The Case for S&P 2500 - December 2013
Commentary
and News
2nd Quarter 2026
US Market Commentary
Investors and the financial media are overlooking what may be the most significant cycle shift in the past 20 years and may need a new "playbook".
Large Cap Intrinsic Value
Strategy Review
Intrinsic Value Opportunity
Strategy Review
International Market Commentary
U.S. strategies (generally growth oriented), which have dominated since the Great Financial Crisis (GFC), have begun to underperform International strategies, and we believe this is indicative of a regime change that should last for some time to come.
International Intrinsic Value
Strategy Review
Global Intrinsic Value Equity Income
Strategy Review
International Intrinsic Value Opportunity
Strategy Review
1st Quarter 2026
US Market Commentary
Investors entering the quarter expecting a broad economic advance and easing inflationary concerns were whipsawed by the war and concerns over higher inflation and slowing growth. The result was a down quarter of -4.3% for the S&P 500.
Large Cap Intrinsic Value
Strategy Review
Intrinsic Value Opportunity
Strategy Review
International Market Commentary
Global investors entered 2026 anticipating a synchronized economic upturn and waning inflation concerns. Instead, they were caught off guard by geopolitical tensions and resurging inflation risks, as the Israel-Iran conflict rippled across supply chains and commodity markets, and had to deal with an oil shock instead.
International Intrinsic Value
Strategy Review
Global Intrinsic Value Equity Income
Strategy Review
International Intrinsic Value Opportunity
Strategy Review
4th Quarter 2025
US Market Commentary
We remain constructive on the U.S. stock market, as it is supported by solid economic fundamentals, resilient consumer spending, and healthy corporate earnings. The Federal Reserve is expected to continue cutting rates later this year, as nominal GDP growth is booming.
Large Cap Intrinsic Value
Strategy Review
Intrinsic Value Opportunity
Strategy Review
International Market Commentary
International markets soundly beat the U.S. last year, and we expect that trend to continue. These markets appear to be entering a secular bull phase that could last for years, driven by structural economic changes and a shift toward pro-growth fiscal policies.
International Intrinsic Value
Strategy Review
Global Intrinsic Value Equity Income
Strategy Review
International Intrinsic Value Opportunity
Strategy Review
3rd Quarter 2025
US Market Commentary
The highlight of the quarter, as we saw it, was the Federal reserve getting "Back in the Saddle" and lowering rates. After not reducing rates since last December, and maintaining much higher rates than most Developed Economies, the Fed resumed lowering rates...
Large Cap Intrinsic Value
Strategy Review
Intrinsic Value Opportunity
Strategy Review
International Market Commentary
International economies have seen growth accelerate and act better than most investors expected as stimulus policies are starting to be implemented. We believe this trend should continue.
International Intrinsic Value
Strategy Review
Global Intrinsic Value Equity Income
Strategy Review
International Intrinsic Value Opportunity
Strategy Review
2nd Quarter 2025
US Market Commentary
It's been quite a market run off the bottom for US stocks, gaining over 26% since early April. The first half can be summed up with three phrases for three phases...
Large Cap Intrinsic Value
Strategy Review
Intrinsic Value Opportunity
Strategy Review
International Market Commentary
International Markets just confirmed that they have entered a secular bull, by breaking to the first new highs since 2007. Remember, the S&P confirmed its' secular bull by breaking to a new high in 2013, and since then it has gained over 14% per year after compounding at 3% for the 2000- 2013 period. We think the recent breakout of the ACWI ex-US indicates similar potential with the rally to new highs!
International Intrinsic Value
Strategy Review
Global Intrinsic Value Equity Income
Strategy Review
International Intrinsic Value Opportunity
Strategy Review
1st Quarter 2025
US Market Commentary
We could wax eloquent on the first quarter, but the most important market developments began in April and probably center on the "outlook" side of this update.
Large Cap Intrinsic Value
Strategy Review
Intrinsic Value Opportunity
Strategy Review
Intrinsic Value Opportunity 15
Strategy Review
International Market Commentary
International Investments outperformed the S&P by a wide margin during the first quarter as a fundamental pivot in economic growth is brewing, favoring international over US growth.
International Intrinsic Value
Strategy Review
Global Intrinsic Value Equity Income
Strategy Review
International Intrinsic Value Opportunity
Strategy Review